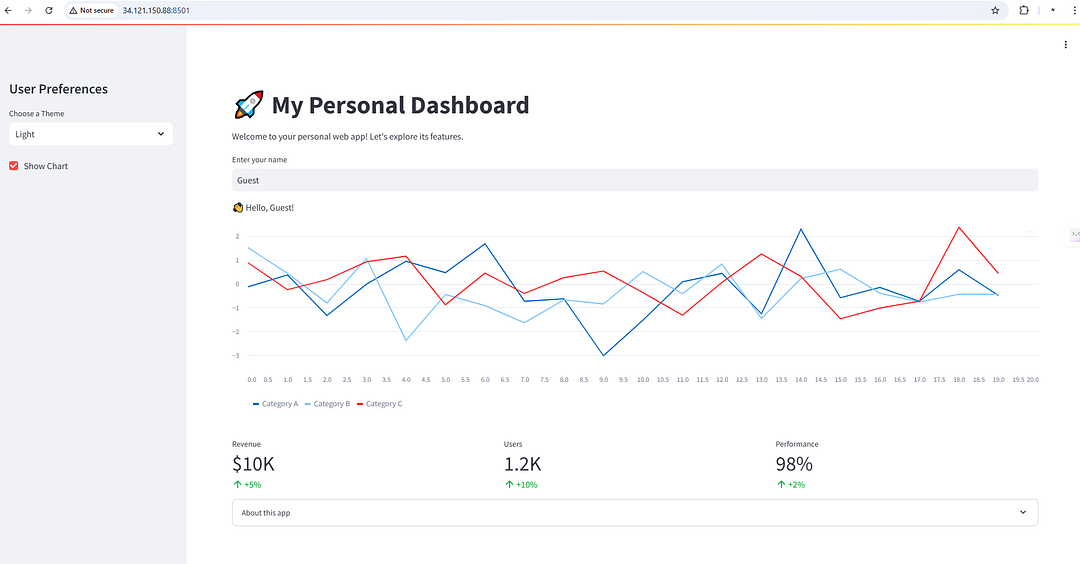
Building interactive web apps has never been easier, thanks to Streamlit, a Python framework designed for simplicity and speed. In this blog, we’ll guide you step-by-step on how to create a dynamic dashboard with Streamlit. By the end, you’ll have a fully functional web app that you can further extend for machine learning (ML) and data science use cases.
Introduction to Streamlit
Streamlit is a Python-based open-source framework that allows developers to create intuitive web apps with minimal effort. Unlike traditional web development tools, Streamlit simplifies the process by eliminating the need for extensive front-end coding.
Installing Streamlit
Before we begin, ensure Python is installed on your system. To install Streamlit, open your terminal and run the following command:
[root@awx streamlit]# pip3 install streamlit
This will set up Streamlit in your environment, ready to power your first web application.
Setting Up Your Dashboard
To start building the app, create a Python file named app.py and add the following imports:
import streamlit as st
import pandas as pd
import numpy as np
Page Configuration
Set the app’s title and layout for a professional appearance:
st.set_page_config(page_title="My Dashboard", layout="wide")
Streamlit automatically ensures a responsive layout for any device.
Enhancing User Experience with a Sidebar
To make the app more user-friendly, add a sidebar. Use the following code to include a dropdown for themes and a checkbox:
st.sidebar.title("User Experience")
theme = st.sidebar.selectbox("Choose a theme", ["Light", "Dark"])
show_chart = st.sidebar.checkbox("Show Chart", value=True)
While the dropdown is a placeholder for now, the checkbox lets users toggle the visibility of charts dynamically.
Adding Interactivity
Interactive apps engage users better. Let’s add a text input field for users to enter their name:
name = st.text_input("Enter your name", value="Guest")
st.write(f"Hello, {name}!")
As the user types, the greeting updates instantly, showcasing Streamlit’s live-update capability without page reloads.
Integrating Charts
Visualizations are an integral part of dashboards. Use the following code to generate random data and display a line chart:
if show_chart:
    data = pd.DataFrame(
        np.random.randn(20, 3),
        columns=["Category A", "Category B", "Category C"]
    )
    st.line_chart(data)
else:
    st.write("Chart hidden. Enable it from the sidebar.")
This section dynamically renders the chart based on the checkbox selection.
Highlighting Key Metrics
Dashboards often include key performance metrics. Divide the page into three sections for revenue, users, and performance stats:
col1, col2, col3 = st.columns(3)
col1.metric("Revenue", "10k", "+5%")
col2.metric("Users", "1.2k", "+10%")
col3.metric("Performance", "98%", "+2%")
With this, you get a professional layout that’s visually appealing.
Adding Additional Information
To include tips or documentation, use expandable sections:
with st.expander("About this app"):
    st.write("This app demonstrates the power of Streamlit for creating dynamic dashboards.")
Expandable sections are ideal for including extra content without overwhelming the main interface.
You can find a complete code here.
Running the App
To see all the changes, save your file and run:
[root@awx streamlit]# streamlit run app.py
Visit the generated URL in your browser to interact with your fully functional app.
[root@awx streamlit]# streamlit run app.py

Collecting usage statistics. To deactivate, set browser.gatherUsageStats to false.


  You can now view your Streamlit app in your browser.

  Local URL: http://localhost:8501
  Network URL: http://10.128.0.2:8501
  External URL: http://34.121.150.88:8501

Conclusion
With this guide, you have learned how to create a dynamic and interactive web app using Streamlit. From setting up the dashboard to integrating metrics and charts, these steps provide a solid foundation to build and customize powerful applications.
Streamlit’s simplicity and real-time interactivity make it a great choice for showcasing data insights and building functional dashboards. Share your thoughts or enhancements to continue improving this experience!
Check out my other blogs on Python.


