Monitoring servers is no longer optional — it is essential for reliability. Without monitoring, you are left guessing whether CPU, memory, disk, or network caused a crash. With monitoring in place, you always stay in control.
In this guide, you will learn how to build a complete Prometheus monitoring setup with Node Exporter and Grafana on Linux. All services will be configured as systemd services so they start automatically after reboot and recover on failure.
Prefer video? Watch the full setp-by-step tutorial on YouTube.
Why Monitoring Matters
Effective monitoring answers three critical questions:
- Is everything working?
- If not, what broke?
- How can it be prevented from breaking again?
Without a monitoring stack, teams are stuck in reactive mode. With monitoring tools like Prometheus, Grafana, and Node Exporter, you gain proactive visibility into system health.
What We Will Build
This Linux monitoring stack will include three core components:
- Node Exporter → Collects CPU, memory, disk, and network metrics from the Linux server.
- Prometheus → Scrapes and stores metrics in a time-series database.
- Grafana → Visualizes metrics with customizable dashboards.
All three will be managed by systemd services for resilience and auto-start on reboot.
Step 1: Install Prometheus
Download and install Prometheus:
wget https://github.com/prometheus/prometheus/releases/latest/download/prometheus-3.5.0.linux-amd64.tar.gz
tar -xvf prometheus-*.tar.gz
mv prometheus-*/prometheus /usr/local/bin/
mv prometheus-*/promtool /usr/local/bin/
mkdir -p /etc/prometheus /var/lib/prometheus
Prometheus Configuration
# /etc/prometheus/prometheus.yml
global:
  scrape_interval: 15s

scrape_configs:
  - job_name: 'prometheus'
    static_configs:
      - targets: ['localhost:9090']
Systemd Service for Prometheus
# /etc/systemd/system/prometheus.service
[Unit]
Description=Prometheus Monitoring
After=network.target

[Service]
ExecStart=/usr/local/bin/prometheus \
  --config.file=/etc/prometheus/prometheus.yml \
  --storage.tsdb.path=/var/lib/prometheus
Restart=always

[Install]
WantedBy=multi-user.target
Now, enable and start the Prometheus Service:
sudo systemctl daemon-reload
sudo systemctl enable --now prometheus
Lets verify: http://localhost:9090
Step 2: Install Node Exporter
Download and install Node Exporter:
wget https://github.com/prometheus/node_exporter/releases/latest/download/node_exporter-1.9.1.linux-amd64.tar.gz
tar -xvf node_exporter-*.tar.gz
sudo mv node_exporter-*/node_exporter /usr/local/bin/
Systemd Service for Node Exporter
# /etc/systemd/system/node_exporter.service
[Unit]
Description=Node Exporter
After=network.target

[Service]
ExecStart=/usr/local/bin/node_exporter
Restart=always

[Install]
WantedBy=multi-user.target
Now, enable and start the Service:
sudo systemctl daemon-reload
sudo systemctl enable --now node_exporterVerify: http://localhost:9100/metrics
Step 3: Connect Node Exporter to Prometheus
Update prometheus.yml:
  - job_name: 'node_exporter'
    static_configs:
      - targets: ['localhost:9100']
Restart Prometheus:
sudo systemctl restart prometheus
Prometheus will now scrape metrics exposed by Node Exporter.
Step 4: Install Grafana
Install Grafana on Linux:
sudo apt-get install -y software-properties-common
sudo add-apt-repository "deb https://packages.grafana.com/oss/deb stable main"
wget -q -O - https://packages.grafana.com/gpg.key | sudo apt-key add -
sudo apt-get update
sudo apt-get install grafana
sudo systemctl enable --now grafana-serverVerify: http://localhost:3000
(Default credentials: admin / admin)
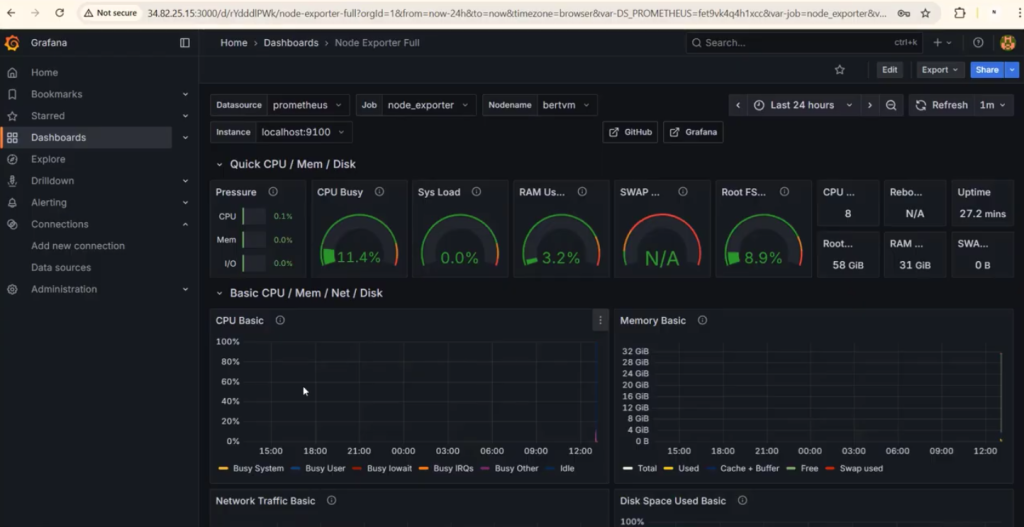
Step 5: Import Grafana Dashboard
- Open Grafana → Dashboards > Import
- Use Dashboard ID: 1860 (Node Exporter Full Dashboard)
- Select Prometheus as the data source
You will now see CPU, memory, disk, and network metrics beautifully visualized.
Step 6: Make the Setup Production-Ready
- All three services (Prometheus, Grafana, Node Exporter) run as systemd services
- They auto-start on reboot
- They recover on crashes with
<strong>Restart=always</strong> - Logs are available through
journalctl
Conclusion
You now have a complete Linux monitoring setup:
- Node Exporter collects metrics
- Prometheus scrapes and stores them
- Grafana visualizes everything
With this Prometheus monitoring setup, you gain proactive visibility into your infrastructure.